Shipping is the most observable large-scale economic activity on the planet. Roughly 100,000 commercial vessels above 100 gross tons are trading at any moment, most of them broadcasting their identity and position continuously, in the clear, on VHF. That makes maritime traffic the richest open-source dataset available to a civilian analyst — and also one of the most systematically manipulated. The discipline is not in finding the data. It is in knowing which fields are machine-generated, which are typed in by a tired second officer, and which are lies with a commercial motive behind them.
The AIS layer, and what it actually reports
Automatic Identification System transponders are mandatory under SOLAS for vessels of 300 gross tons and above on international voyages, 500 gross tons on domestic voyages, and all passenger ships regardless of size. Class A units transmit dynamic position reports every two to ten seconds when underway and every three minutes at anchor. Class B units, fitted to smaller craft, transmit less often at lower power and are easier to miss.
The feed splits into three categories, and they are not equally trustworthy.
- Dynamic data is drawn from the vessel’s GNSS receiver and gyro: position, speed over ground, course over ground, true heading, rate of turn, navigational status. This is the hard part of the record.
- Static data is programmed once and rarely touched: MMSI, IMO number, call sign, vessel name, ship type, length and beam, antenna offset.
- Voyage data is typed in by the crew: reported draught, destination, ETA, hazardous cargo indicator. This is the soft part of the record. Destination fields are abbreviated, misspelled, stale by a week, set to a region rather than a port, or deliberately blank.
Reception matters as much as transmission. Terrestrial receivers pick up AIS out to roughly 40–60 nautical miles depending on antenna height, so coverage is dense along Europe, East Asia and North America and thin across the middle of oceans. Satellite AIS closes the gap but introduces revisit latency and message collision in crowded waters. A gap in a track is therefore ambiguous by default: it may be intent, or it may be a receiver that was never there.
Identity resolution: IMO first, everything else second
The IMO number is assigned to a hull for life and does not change with sale, rename or reflag. Name, flag, MMSI, registered owner, manager and insurer all change — sometimes several times in a single year for a vessel being moved out of the regulated market. Build every file around the IMO number and treat the rest as attributes with timestamps.
Free and low-cost identity sources worth having bookmarked:
- Equasis — ownership, management, classification, and port state control inspection history for most of the world fleet.
- ITU MARS — MMSI and call sign assignments by administration.
- Classification society registers — DNV, Lloyd’s Register, ABS, ClassNK, Bureau Veritas: survey status, and whether class has been withdrawn.
- Paris MOU and Tokyo MOU databases — detentions, deficiencies, banned vessels.
- Flag state registries — variable quality, but useful for confirming or disproving a claimed registration.
A hull that changes name, flag and technical manager in the same quarter while keeping its IMO number is not doing housekeeping. That pattern alone justifies a file.
Ownership is layered on purpose
Commercial shipping separates registered owner, technical manager, commercial manager, charterer and beneficial owner as a matter of routine liability engineering. Single-ship companies registered in Liberia, the Marshall Islands, Panama or Malta are normal, not suspicious in themselves. What makes them analytically useful is that the layers leak through shared attributes.
Look for a common registered address across dozens of otherwise unrelated single-ship companies, one technical manager appearing across a fleet with no other visible connection, blocks of sequential IMO numbers acquired in the same window, a shared crewing agency, a shared insurer, or a shared satellite communications provider. Correlation across three or more of these is a stronger signal than any single corporate document.
Behavior beats declarations
Self-reported fields can be forged. Behavior over weeks is much harder to fake convincingly, because it has to remain economically coherent.
- Transponder gaps clustered around known transfer areas rather than distributed randomly across a voyage.
- Loitering and drifting in international waters off transfer anchorages — Fujairah, off Malaysia’s east coast, the Gulf of Oman, Kalamata, Ceuta, Lomé — with no cargo event to justify the time.
- Ship-to-ship transfer signatures: two hulls converging to near-zero speed, remaining within a few hundred metres for twelve to forty-eight hours, then departing in different directions with reported draughts moving in opposite directions.
- Draught as a cargo proxy: a reported draught that shifts by several metres brackets a load or discharge. A draught that does not move across a claimed port call suggests no cargo work happened there.
- Speed economics: a laden tanker steaming at eight knots on a route normally run at twelve is storing cargo, waiting for a buyer, or waiting for paperwork. Fuel is expensive; slow steaming with cargo aboard is a decision, not an accident.
- Spoofing signatures: positions on land, tracks that repeat with implausible precision, tight circular patterns typical of GNSS manipulation near sensitive coastlines, instantaneous jumps of hundreds of miles, or two hulls broadcasting the same MMSI in different hemispheres. Distinguish spoofing, which produces false positions, from jamming, which produces no position at all — the first implies an actor with a story to tell, the second usually implies proximity to electronic warfare activity.
Satellite imagery as the independent check
Imagery is what turns an AIS anomaly into a finding.
Sentinel-1 SAR is the workhorse for dark-vessel detection: it images through cloud and at night, and a steel hull returns a strong signature whether or not the transponder is on. The core method is straightforward — take a SAR scene, take every AIS position within the same footprint and time window, and match them. Unmatched detections are candidates, subject to filtering for fixed structures, small craft and wind artefacts.
Sentinel-2 optical at 10 metres, free and on a roughly five-day revisit, is enough to count hulls at berth, measure anchorage congestion, and see whether a terminal is working. Commercial sub-metre imagery from Planet, Maxar or Airbus resolves crane positions, container stack heights and hatch cover status when the question justifies the cost.
VIIRS night-time imagery picks out fishing fleets running deck lights and gas flaring at terminals and refineries. Shadow measurement on floating-roof tanks in optical imagery gives a workable estimate of crude and product storage levels at a tank farm across a time series.
Port-side observation is underrated
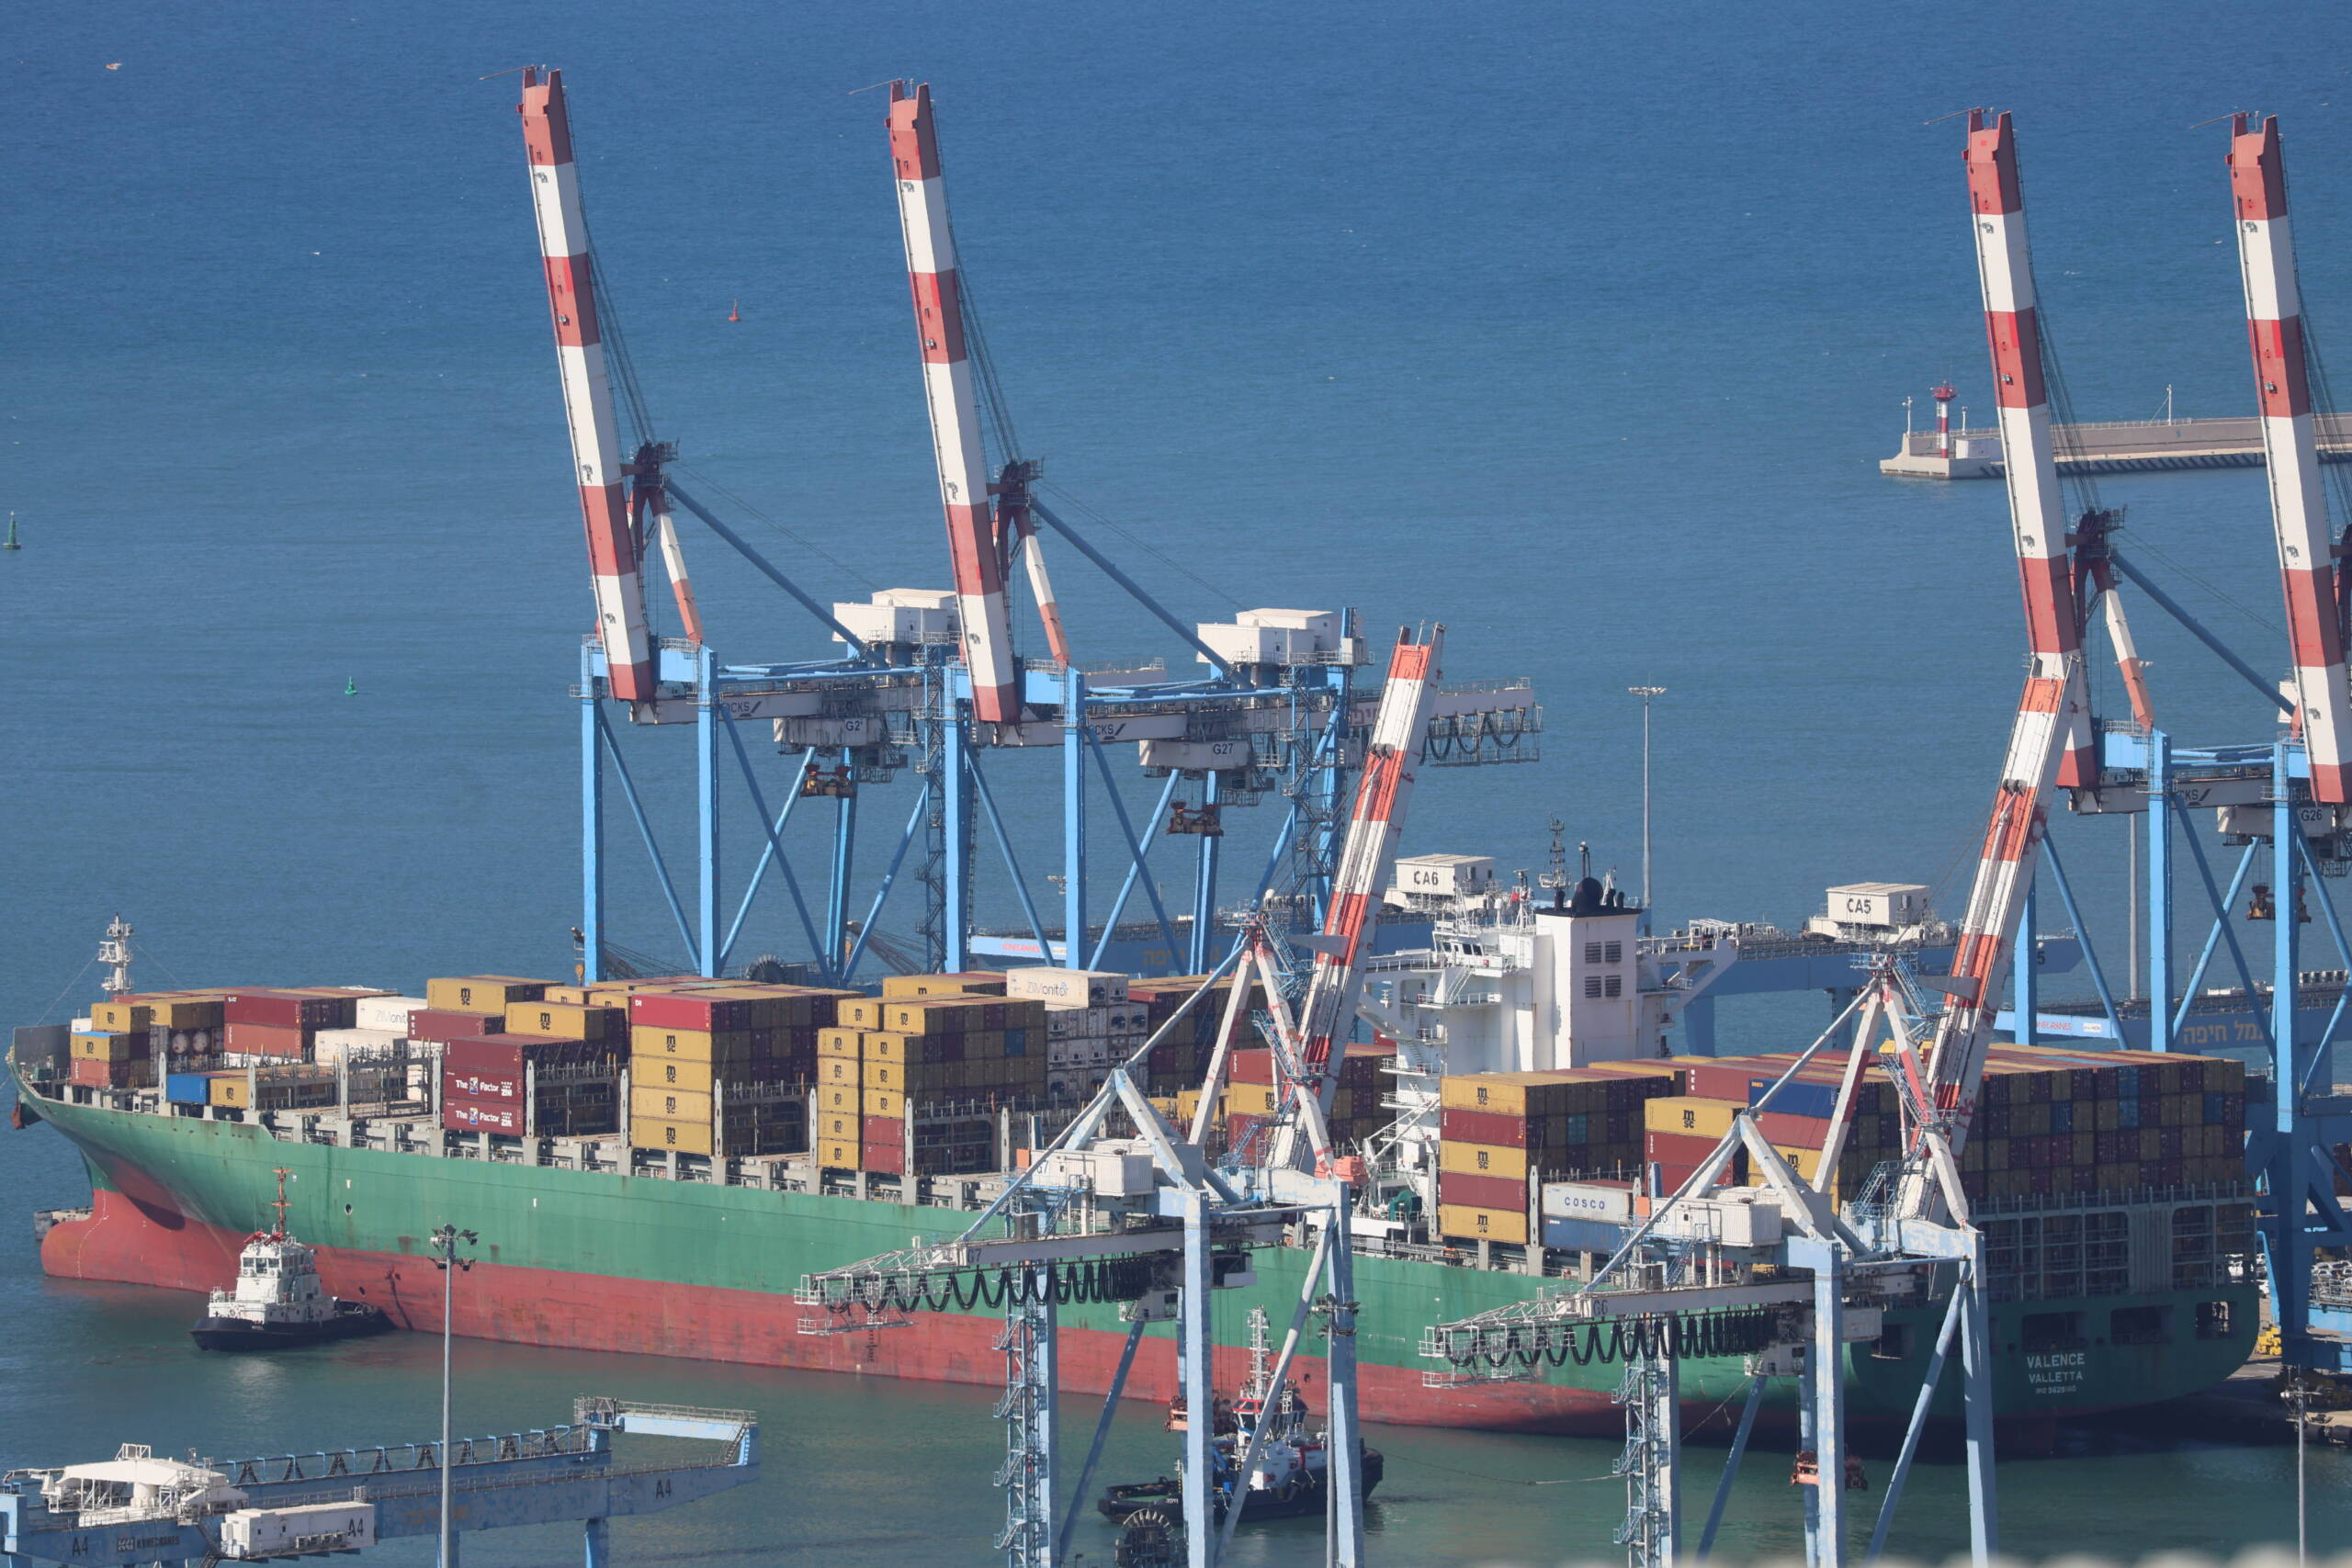
The frame above is one photograph of a container terminal, and it carries more than a casual look suggests. The vessel’s name and port of registry are painted on the stern with the IMO number stencilled beside them, which fixes identity independently of any transponder. The crane numbering and terminal livery identify the operator and the specific berth. The container markings identify which lines hold slots on that service. Two tugs standing by a moored ship while gantries are still working indicates a departure being prepared rather than a mid-call lull.
Set that against the berth’s AIS history for the same window and you have vessel, service, time alongside, and a plausible ceiling on crane moves completed. Repeatable sources for this layer include harbour webcams, timestamped ship-spotter photo streams, published berthing schedules and harbour master notices, pilotage and towage movement logs, customs and bill of lading records where jurisdictions publish them, and terminal throughput statistics.
One practical warning: photographing port infrastructure and naval facilities is restricted or outright illegal in many jurisdictions, and the rules are enforced unevenly. Check before you point a lens.
Aggregate indicators
Individual vessels answer narrow questions. System-level questions need counting.
Build your own baselines rather than inheriting headline numbers — transit counts through Hormuz, Bab el-Mandeb, Suez, the Panama Canal, Malacca, the Bosphorus and the Danish straits, measured on a rolling thirty-day window so that seasonality and single-day noise do not drive the conclusion. Then triangulate against price data, which usually moves before official statistics are published: container spot indices, dry bulk and tanker freight indices, war-risk premium quotes, bunker prices at Singapore, Fujairah and Rotterdam, canal authority transit reports, and the ratio of vessels at anchor to vessels at berth at major ports.
Sanctions and dark-fleet screening
Vessel-level designations appear on the OFAC SDN list, EU consolidated list, UK OFSI list and UN sanctions lists, usually keyed to IMO number. The screening question is rarely whether a hull is listed — that part is a lookup. It is whether a hull is behaving like one that expects to be listed.
Indicators that cluster: reflagging into registries with no functioning verification process, continued trading after deletion from a registry, a claimed flag the registry itself denies, insurance certificates from providers with no recoverable claims history, class withdrawn and not replaced, and an age profile well past the point where a legitimate operator would still be trading the hull.
Where the method breaks
AIS is a self-reported broadcast, not radar. Absence of signal is not evidence of concealment. One vessel is not a trend, and any claim about volumes needs a denominator stated out loud. Commercial platforms present inferred voyage and destination data alongside observed positions without always distinguishing them, so keep observation and inference in separate columns in your own notes. Timestamps go in UTC, without exception, because half the analytical errors in this field are timezone errors.
The data is generous. The confidence should not be.